FitnessSyncer Dashboard
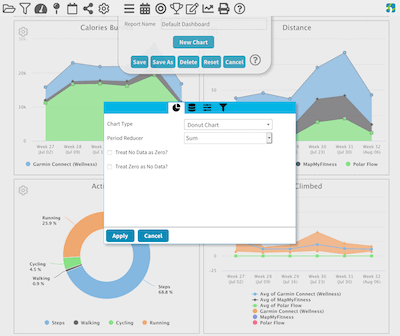
FitnessSyncer Dashboard is a reporting dashboard that allows you to see your health and fitness over time via graphs and charts. Quickly spot trends or anomalies in your exercise routines and stay motivated.
The Dashboard is entirely based on the data which you have in FitnessSyncer, so to get started with the Dashboard, add Data Sources or a FitnessSyncer Notebook entry.
You may filter your data using the filter icon , where you can remove duplicate data or select the sources used in the display. FitnessSyncer Pro users can also choose the types of activities they would like to be shown, such as only showing Runs, Swims, and Cycling trainings.
By default, we show the data in a weekly granularity. You can change this by selecting the chart granularity icon and you may choose between day, week, or month.
You can control the imperial or metric setting and time zone of the display on the Dashboard on your Profile. Note that if you have saved a copy of the Dashboard, you may need to manually change the data for the charts to reflect your preferences.
You can also share the Dashboard with your family, friends, and colleagues via the share icon . When you select this option, you will be asked if you wish to share the current Dashboard or all Dashboards, and will then have the ability to share the item on Facebook, X, E-mail, or to post a link. You can revoke your sharing on the Sharing section of your Profile.
Any chart worth a closer look can fill the screen. Hover it and press the expand icon in its top corner, and the chart is drawn at the size of the whole window. Press the close icon or the Escape key and it goes back where it was, at the size it was. This is just a way of looking at a chart, so nothing is saved: filters, granularity and the chart itself are all unchanged, and a pivot’s filters can still be applied while the chart is full screen.
Click a point on any chart with a date along the bottom to write an annotation about what was happening, so that a spike still makes sense to you months later. Annotations follow the measurement rather than the chart, so one annotation shows up wherever that data is drawn.
A chart drawn a day at a time is a summary, and the readings underneath it are often far more detailed. Where that is true, the chart offers a second icon beside the expand one. Press it and the chart fills the screen showing what was actually recorded, with a row of buttons across the top for how closely to look. A chart of days offers Per hour and Per minute, a chart of months offers Per day, and so on. This appears only when there is enough data to be worth it, so a Temperature chart built from two readings a week does not offer it. Per minute is a FitnessSyncer Pro feature; every other level is available to everyone.
Every chart can also show you the numbers behind it. Press the table icon beside the expand one, and the chart’s own values open as a table you can read and sort by any column, with the dates down the side and one column per series. A Download button on that table saves the same numbers as a CSV file, ready to open in a spreadsheet.
The note editor offers the same thing for one point. Clicking a Tuesday on a chart of days gives you a Show each hour of that Tuesday button above the note, which opens those hours rather than the most recent ones. Either way this is only a way of looking at your data, the same as going full screen: nothing is saved, the chart itself is untouched, and closing the window puts the chart back exactly as it was.
Users on our free tier can only see the most recent 30-day’s worth of data and cannot customize the dashboard. Learn more about becoming a FitnessSyncer Pro.
Available Reports
FitnessSyncer includes a few ready-made reports you can open from the Report Load menu . These are available to every account, including the free tier:
- Default Dashboard: The standard dashboard shown when you first visit FitnessSyncer Dashboard, with charts visualizing your health and fitness data.
- Health Report: A quick snapshot of your latest health data — your Personal Details along with your most recent Blood Pressure, Glucose, Blood Panel, and Weight readings, plus your current Allergies, Conditions, and Medications.
- Heart Report: Charts tracking your heart health over time, including Resting, Minimum, Maximum, and Average Heart Rate, Heart Rate Variability (HRV), Oxygen (SpO2), Respiratory Rate, Sleeping Heart Rate, and Sleep by Type.
- Diabetes and Glucose Report: Charts tracking your Glucose, an Estimated A1C from your average glucose over the last 90 days, your time spent in, above, and below range, Glucose by Time of Day, Glucose versus Carbohydrates and Glycemic Load, and your combined nutrition information.
- Sleep Quality Report: Charts tracking your Sleeping Hours, Sleep Efficiency, Sleep Debt, HRV, Sleeping Heart Rate, Sleep by Type, Awakenings, and Settling Time. It also lays your recent nights out one under another, each divided into the stages your device recorded, so you can see when you were in deep sleep or awake and for how long.
- Body Composition Report: Charts tracking your Weight, Body Mass Index, Fat Ratio, Fat Mass, Fat Free Mass, Muscle Mass, Body Water Percentage, Bone Mass, and a combined chart of your Fat Mass, Muscle Mass, and Bone Mass. If you have had a bone density scan, it is here too: a grid gives each skeletal site the scan reported, named exactly as the scan printed it, with the density, T-score and Z-score beside it and the scan’s own note underneath, and a chart plots any one of those three across every scan you have. FitnessSyncer shows you these numbers as they arrived and does not interpret them, so talk to your clinician about what they mean.
- Blood Pressure Report: Charts tracking your Systolic and Diastolic Blood Pressure, Pulse Pressure, number of Blood Pressure Measurements, Mean Arterial Pressure, and Pulse.
- VO2 Max and Fitness Age Report: Your latest VO2 Max, Fitness Category, and Fitness Age, along with a chart tracking your VO2 Max over time.
- Cycle Tracking Report: Charts tracking your logged Flow Level, Basal Body Temperature, Cervical Mucus, and Ovulation Test results over time.
- ECG Report: A summary of the ECG recordings synced from your Apple Watch, Fitbit, Withings, or other ECG-capable device — how many you have taken, how they break down by the classification your device reported, and the waveform of your most recent recording. The classification always comes from the device that made the recording and is not for diagnostic use.
- Blood Panel Report: Your blood draws over time. A chart plots one analyte at a time across every draw you have, with the laboratory’s own reference range behind it where they sent one, and a grid below lists every analyte each draw measured, with that range and the flag they sent beside it. Charts track your cholesterol, triglycerides and the other analytes we recognize. Where a laboratory sent no range, nothing is inferred: the result is shown as it arrived. FitnessSyncer relays what your laboratory reported and does not interpret it, so talk to your clinician about what it means.
- Trends: What actually changed. We compare the last four weeks of each metric we watch against the three months before them, and tell you only about the ones that really moved — a change has to be both statistically significant and large enough to matter before it earns a place, so an ordinary month says very little. Each change gets a chart showing the two averages side by side, and a table lists the rest, including anything we could not check because too few days were logged.
- Data Overview: A look at where your data comes from and where it’s being sent, including a diagram of your Data Sources and Destinations.
- Goals Report: How you are doing against the goals you have set. Recurring goals — a daily step count, a weekly distance — show how often you hit them, your current streak and your best one, with a chart marking every period you met the target. A goal with a fixed target, such as a weight to reach, instead gets an estimate of when you will get there at your recent rate.
On the Blood Pressure, Diabetes and Glucose, and Body Composition reports, the For a visit option in the toolbar opens FitnessSyncer Print over the same dates the report is showing, ready to print or save as a PDF for an appointment.
If you are using one of our apps, the Reports also include Your Best and Leaderboards.
FitnessSyncer Pro users also have access to the FitnessSyncer Report Sampler described below.
You can hide any of these built-in reports from the Report Load menu without deleting anything; see Default Report List and FitnessSyncer Notebook Categories on the Preferences page.
To receive any of these reports by e-mail as a PDF file, every day, week or month, add a Reports by e-mail as PDF files destination. It is free, and Pro users can choose their own dashboards too.
Dashboards for FitnessSyncer Pro Users
FitnessSyncer Pro users have the most powerful experience on FitnessSyncer Dashboard. You can customize the dashboard, create unlimited reports, advanced filtering capabilities including by sport and date range, and more!
In addition to the ability to Filter by Activity Type, you also can quickly see different views of your data using presets or be able to customize the date range to zoom into the precise data you are interested in.
FitnessSyncer Pro users can also customize and save an unlimited number of Dashboards with many data visualizations to help you get the most of your data.
Everything you can build is on its own page, Customizing the FitnessSyncer Dashboard:
- Dashboard Customization: edit mode, adding and arranging charts, cloning a chart into another report.
- Report Settings: a report’s name, colors, default granularity and scope.
- Chart Configuration: every chart, pivot table, indicator, collection and element you can add, and each tab of the chart editor.
FitnessSyncer Report Sampler
FitnessSyncer provides a lot of charts and options for chart configuration. To help you get up and running quickly, we have FitnessSyncer Report Sampler, which shows you all of your data in various charts we’ve already created.
See one you like? Click the Gear and then select the Add To Dashboard option. This will allow you to pick the Dashboard you wish to add it to.
All of the charts on this page are based on your data. For example, if you do not have Blood Pressure data, there will not be blood pressure charts.
Reference Bands
Several charts are shaded into labelled bands behind your data, such as Normal, Elevated, Fever, and so on. They exist because a number on its own is hard to read: a systolic of 128 or an oxygen reading of 94% means little until you can see which range it falls in. The bands appear automatically on any chart showing a single measurement we have ranges for, on the FitnessSyncer Dashboard, in the built-in reports and in FitnessSyncer Compare.
Where the numbers come from depends on the measurement, and it is worth knowing which kind you are looking at:
- Your own settings. Glucose uses the in-range limits you set on your Profile, and heart rate and power zones use the zones you configured there. If you turn on Use my glucose range instead of the standard ranges to use your high number as the indicator. If a band looks wrong for you, this is the kind you can simply change.
- Your age and sex. VO2 Max and resting heart rate are judged against tables adjusted for your profile, because what is a good resting heart rate at 25 is not the same as at 65. Sleep duration is banded by age alone.
- Fixed ranges. Blood pressure, oxygen, BMI, visceral fat, body temperature and cholesterol use published, widely-used ranges that do not vary by person.
Measurements with bands today: blood pressure (systolic and diastolic), glucose, A1C, oxygen, BMI, visceral fat, VO2 Max, heart rate zones, power zones, ECG heart rate, and — newly — body temperature, cholesterol (total, HDL, LDL and triglycerides), resting heart rate and sleep duration.
A1C is banded on the standard thresholds of 5.7% and 6.5%. The Estimated A1C on the Diabetes and Glucose Report always uses those, so the standard view is always available to you, even when you have asked for your own range elsewhere.
The blood pressure bands changed in September 2026. They now follow the 2017 American College of Cardiology and American Heart Association guideline, which the earlier ranges predated.
Two things to keep in mind. Cholesterol’s HDL runs the opposite way to the others: for total, LDL and triglycerides a lower number sits in the better band, while for HDL a higher one does. And body temperature ranges assume an oral or ear reading; an underarm measurement typically reads lower and a rectal one higher, and we have no way to know which you took.
The bands describe a reading; they do not diagnose one. They are there to make a number readable, not to tell you what it means for your health. Nothing on this page is medical advice, and a reading that concerns you is a conversation for your doctor.
See Also
- Chart Annotations
- Customizing the FitnessSyncer Dashboard
 FitnessSyncer App for Android and iOS
- FitnessSyncer AI and MCP Server
- FitnessSyncer Sharing
- Get started with FitnessSyncer
- FitnessSyncer Stream
- FitnessSyncer Compare
- FitnessSyncer Daily Analyzer
- FitnessSyncer Calendar
- FitnessSyncer Your Best
- FitnessSyncer Maps
- Tracking Goals in FitnessSyncer
- FitnessSyncer Notebook
- FitnessSyncer Print
- FitnessSyncer Leaderboards
- Chart Annotations
- Customizing the FitnessSyncer Dashboard
- FitnessSyncer App for Android and iOS
- FitnessSyncer AI and MCP Server
- FitnessSyncer Sharing
- Get started with FitnessSyncer
- FitnessSyncer Stream
- FitnessSyncer Compare
- FitnessSyncer Daily Analyzer
- FitnessSyncer Calendar
- FitnessSyncer Your Best
- FitnessSyncer Maps
- Tracking Goals in FitnessSyncer
- FitnessSyncer Notebook
- FitnessSyncer Print
- FitnessSyncer Leaderboards